Ways of visualising power
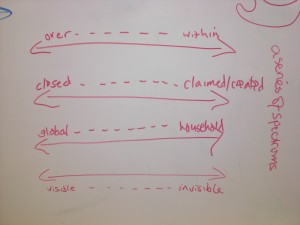
 Visualization of these dimensions of power can be very useful in helping to understand them and to show their interrelationships. There are many ways of doing so, through drawings, cartoons, skits and popular theatre, and the use of various images. Go to pictures in the resources section of this site to view more images. Or go to more ways of visualising power to see pictures drawn by the participants of the power analysis workshiop in June, 2009, hosted by IDS.
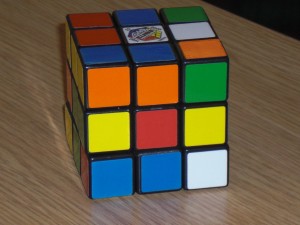
In some uses of the powercube, each of its dimensions can be divided into three parts, making it appear a bit like a Rubik’s cube the famous block toy where we try to align the colours of each block along each side (the Rubik’s cube refers to a mechanical cube invented in 1974 by the Hungarian sculptor and professor of architecture Ernö Rubik, and marketed widely as a puzzle. The sides of the cube can rotate, though the whole remains intact). Like a Rubik’s cube , each side of the cube can be rotated, and in so doing affect the alignment of blocks on other dimensions. While any of the sides may be used as the first point of analysis, each is linked to the other. Go to Wikipedia for more on Rubik’s cube.
 In our work, we have often used the metaphor of the ‘powercube’ to illustrate the dimensions of power and how they are linked, click on the image to the left to see the powercube in action.
The powercube approach, as described earlier, suggests that when strategies and analysis of power are able to work across or ‘align’ across each dimension of the cube, then real transformation of power relations is more likely to occur. Yet this is difficult in practice. As with a Rubik’s cube, changes in one side or dimension of the powecube can cause the other dimensions to go get out of line. This reminds us that analysing one aspect of power without attention to the impact on how it affects other dimensions of power is risky. And, those who study the Rubik’s cube argue that there are literally billions of different positions (more specifically, about forty three quintillion, or 43,252,003,274,489,856,000, according to Wikipedia!) that the blocks of the cube may have, illustrating the complexity and permutations which power can take across level, space and form in any given context. On the other hand, those who study the Rubik’s cube also tell us that any of its dimensions can aligned with the others in a maximum of 29 moves, no matter how out of line they are to start with. While we don’t want to press the comparison to far, this at least gives a hint that change is possible!
While very useful as a heuristic, mapping and strategizing device, we have also found that there are risks in presenting these dimensions of power in this way. The Rubik’s cube may be known to some, but only in certain cultures. Moreover, as we have seen, we are really talking about the interrelationship of various spectra or dimensions, which may each involve more than three ‘neat’ sub-categories – so to use this image may give the impression of static and fixed categories of power. On the other hand, we have seen that there may be various forms, levels and spaces, and that they may change over time. Sometimes, for instance, the invited spaces may be more important in a given setting than the claimed spaces, so we need ways to show the opening and closing of such spaces across time and context.
Certainly in presenting the cube we have found it is better to talk about each dimension one by one, not to start with trying to understand the whole cube from the beginning. For an example of a way to present the powercube one dimension at a time veiw John Gaventa’s powerpoint presentation (see related resources). That can be overwhelming and while the cube imagery works for some, it is seen as too fixed and uncreative for others and can leaving the impression that power relationships and strategies for change can be reduced to mechanical or tick box formulae. So we encourage people to develop the images and visualisations of power which work for them. In fact, there are a number of alternative ways of using it, and a number of innovations on it.
 1) Spectrums rather than boxes. As discussed in the sections above, one can consider the forms, spaces and levels of power, as dimensions or spectra, rather than fixed blocks. In particular, applications in practice have identified many more examples of relevant spaces and levels of power.
2) Moving across time. The powercube could move along a time scale, allowing users to see how power in the powercube changes over time. In one approach participants of a national NGO were asked to discuss which aspects of power they focused their work on 10 years ago and which they focused on now. In doing so, they realised that while they still talked about working on local participation and strengthening peoples’ knowledge of the grassroots, much of their attention was focused more on professional advocacy at the national and international levels.
3) Spinning. The powercube could also be spinning as it moves through time. That way viewers could see power from many angles, rather than one view.
4) Expanding and contracting depending where you enter. As we look at strategies for action we need to have in mind a cube that is thin in some places and expanding in others, showing lots of power in one place and an absence of it in another. But this is not static. As actors enter parts of the powercube, the waves they make by using or changing one kind of power ripple to change dynamics of power in other parts of the powercube.
See some creative images of more ways of visualising power from the June, 2009, Power Analysis workshop hosted by IDS.
However we visualize power, the power cube approach is still only one way of conceptualising and understanding power. It can be used with and linked to other approaches to power as well.

